|
|
||||
|
Accessing monumental architecture and documenting World Heritage sites in India, Italy, and the Vatican City since 2010, the DHARMA team has been using state of the art technologies such as large-scale laser scanning and subsequent point-cloud optimization to assemble a base of operation and visualization of the heritage sites for the public, and especially educators. The team aims to deliver interactive experiences that support multiple modes of exploration and examination of the 3D models: including comparing reconstruction with historical survey maps, isolating individual models for high-resolution rendering, and acquiring contextual documentation of historical building stages. |
||||
 |
Point-cloud scan and reconstruction This showcase is an example of the interactive visualization tool developed by DHARMA visualization team since 2021. Our program was designed to primarily focus on education, and thus obtains a lighter-data delivery using Portree and WebGL. Our visualization team designed visualization structure along with our research projects and documentation of the Roman Forum to integrate archaeological context, high-resolution photography, digital reconstruction, and high-accuracy 3D scan of the majority of the site to capture and deliver a user-friendly platform to navigate and examine the prominent historical site in a greater academic context and architectural detail. More detailed record and discussion are accessible in the published book "From Pen to Pixel". |
|||
|
|
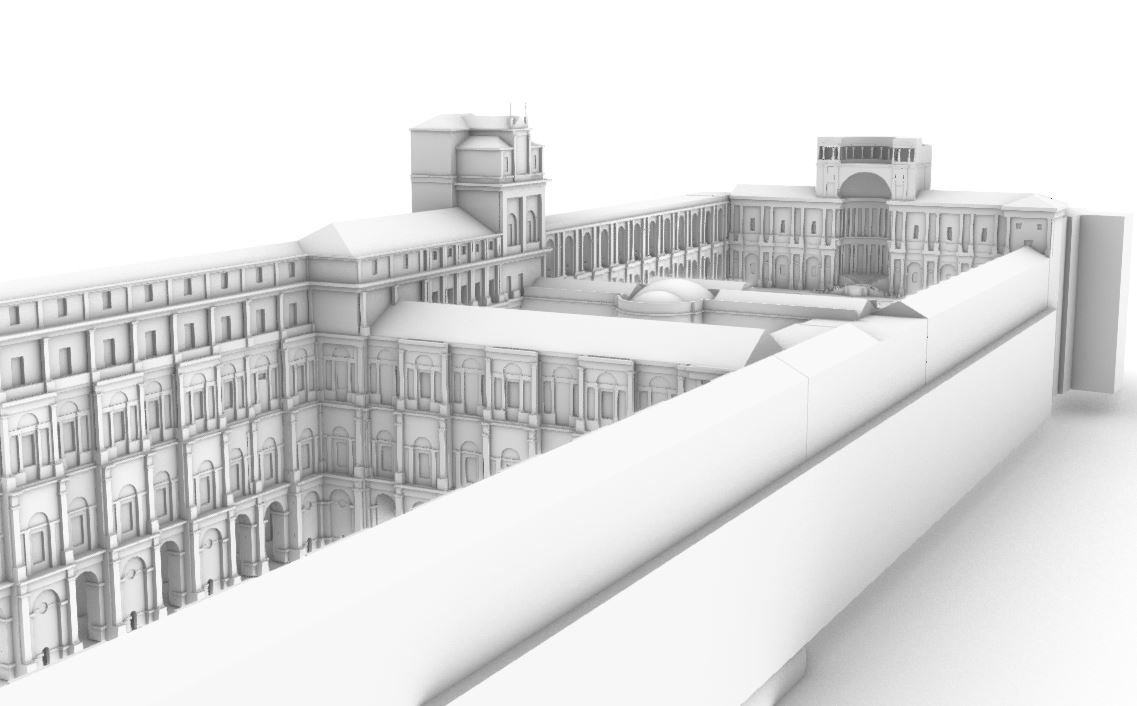
Construction phases The onsite work for documenting the Belvedere started in Fall 2016. Over multiple days (over 12-to-14-hour days) of intense surveys of the site where digital cloud data was collected. The site was surveyed using 4 different documentation techniques. These include, 1) 3D Laser Scanning, 2) Gigapan, 3) Hand survey 4) Field notes. 23 laser scan positions using P20 laser from Leica Geosystems were captured to create a detailed scan survey of the site. The Rhino reconstruction overlays were added during a study from 2019 to 2022. Access Interactive Page |
|||
|
|
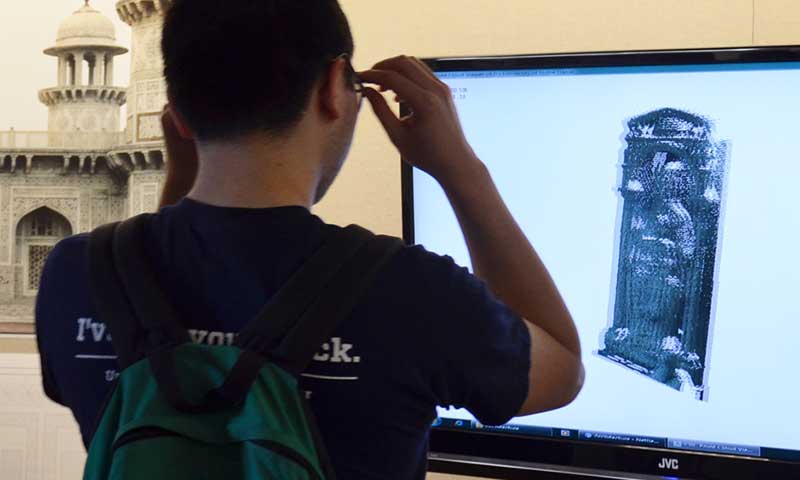
Visualization Tool in Development The Taj study was initiated in 2015 with multiple visits to the site to document the site with methodologies stated in the above projects. The scale of the Taj complex is the largest in our work till date. |
|||
|
|
||||
|
Dr. Krupali Uplekar Krusche
|
Giovanna Lenzi-Sandusky |
|||
|
Dr. Chaoli Wang
|
Chase Brown |
Siyuan Yao |
||
|
Chad Brown |
Blake Caven |
Margaret Zhang |
||

 The Roman Forum, Italy
