 |
||||
|
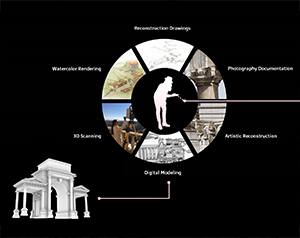
3D Scanning
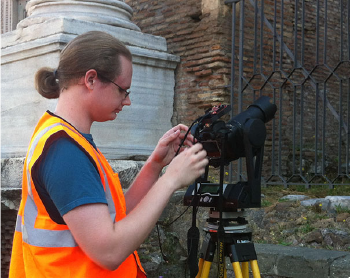
Field Documentation
Software Development |
HDR Photography
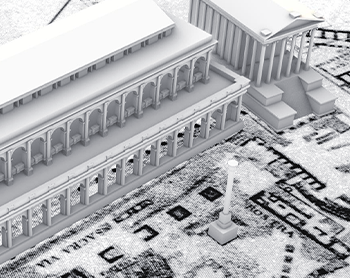
3D Rendering
Visualization Programming |
Drone & Lider Captures
Archival Research
3D Visualization
|
||
|
|
||||
|
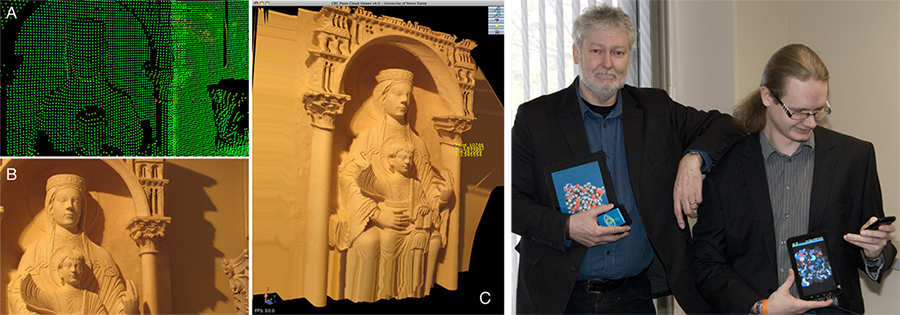
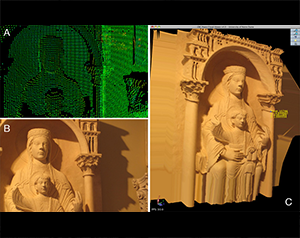
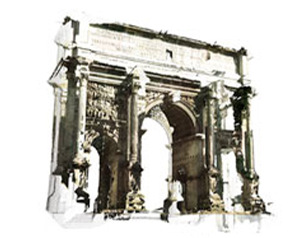
The VisArray project team under the leadership of Dr. Christopher Sweet is exploring methods for combining two primary technologies into a single interactive system for cataloging, analyzing and displaying both point and raster data at extremely high resolutions. VisArray is a visualization framework for rendering scientific data. By combining data acquisition and manipulation in front-end modules with flexible back-end rendering modules our framework has been targeted at a diverse range of projects, from clustering of social network data to visualizing fibrin networks formed during thrombus development. The resulting display can be rendered to traditional displays, 3D hardware, ray traced, embedded in web-portals and, more recently, projected onto Digital Visualization Theater facilities such as the one at Notre Dame's Jordan Hall of Science. Work with the Dharma team led to the creation of a new file format that merges the image and 3D point data. The combined DHZ models, textured point-clouds of artifacts, can be viewed on the Java version of VisArray or the latest iPhone/iPad App. An Android version of the App is currently under development.
Left: The new DHZ file format combines (A) point cloud data and (B) multiple images into (C) a single textured 3D model. This photorealistic model retains the rigorous "skeleton" of point data, enabling detailed measurement and spatial referencing. |
||||